Pages

Showing posts with label exhibits. Show all posts

Saturday, December 31, 2011

Alternate Row Shading


Alternate Row Shading – an easy way to enhance readability, attractiveness, and style

Sometimes, the simplest edits can greatly enhance your presentation. For example, refer to the 2 exhibits below.
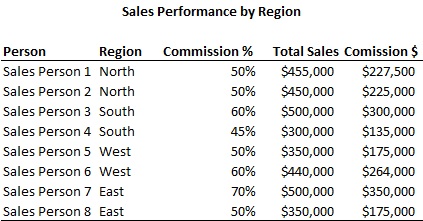

When presenting a sizeable list of items with various columns, the reader may struggle at tracking all the information you are trying to convey. Adding alternate row shading helps the user track a specific row of data with ease.

Adding alternate row shading is quite easy. Just highlight the region where you want to add the shading, then go to Format > Conditional Formatting. Then choose the option to write in your own formula. Type in the following:
=mod(row(),2)=0
Then choose a fill color for your formatting. The exact steps vary between the different versions of Excel, but the general idea remains the same.


Let’s break down this formula. The “Mod()” function takes a number, divides it by the second number, and returns the remainder. The “Row()” function returns the current row. So what the formula does, is that it takes the current row, divides it by 2, and gives the remainder. The remainder will alternate between 1 and 0 depending on your row, since whenever you divide something by 2, the remainder can only be 1 or 0. If it is a 0, then perform the formatting, if it is 1, then do nothing. Keep in mind that you can edit the formatting however you desire. It does not have to be a fill, instead it can be a change in text color, font, borders, etc.

Suppose you want to shade 2 lines at a time, how would you do that? Use the following formula:
=mod(row(),4)>1
Then choose a fill color for your formatting. This formula takes the current row, divides it by 4. The remainders can either be 0, 1, 2, or 3. If it is greater than 1 (2 or 3), then shade it, else (0 or 1) leave it alone. As a result, 2 rows are shaded at a time.


If you want to shade every 4th row, then use:
=mod(row(),4)>2
Then choose the formatting you want. You may need to adjust the number of rows before your exhibit begins to get it to shade the 4th row. In other words, you may need to paste or delete rows around your exhibit to adjust the where the shading occurs.


To see these exhibits on a spreadsheet, please download it here.


Monday, December 26, 2011

Formatting - call me superficial, but aesthetics do matter (part 1)


Formatting – call me superficial, but aesthetics do matter (part 1)
Whenever I am working on a spreadsheet, I always like to be thoughtful about the viewer and the medium.  For example, if I know that the viewer will be a client paying extravagant fees for my work, I want my work to be stylish, clean, elegant, and near perfect.  In this case, my work will most likely be pasted into a deck, so design and simplicity is more important than functionality and flexibility.  On the contrary, if I know that other analysts will be editing and tinkering with my spreadsheet, I want to focus on functionality, flexibility, and ease of manipulation.

Suppose you want to present the data below to a client in a deck.

Clearly, the information isn’t presented in a very attractive manner.  The numbers should be formatted, gridlines removed, titles bolded, headings for numerical columns right aligned, borders drawn in, etc.  Below are a few ways to enhance the look and feel.

A minimalist approach, used for those that prefer simplicity:

A trendy, modern approach, used for those that like to add some style to their data.  Notice the use of alternate row shading to make it easier for the user to differentiate between rows.

A boxier, conventional approach, used for those who prefer a more conservative look.

As you can see, there are many things you can do to add style and creativity in presenting your findings.  Of course, there’s no right or wrong approach; the important thing is to be thoughtful of the context and your purpose.  If a certain column is more important than the rest, then go ahead and box it, bold it, give it a different color, etc.  If something looks ugly, then think about how to make it look better.  If your company uses a standard color scheme, then use those colors.  There truly is an infinite number of possibilities in designing client-ready, value-added exhibits.

However, there are certain things that I like to do.  I generally don’t like to merge cells when centering words over multple cells, because I feel that it makes it more difficult to manipulate your exhibits later on.  Instead, I type in the word in the left most cell of the region that I want to center across, highlight the region, then choose “Center Across Selection” under Format Cells > Alignment (highlight region, CTRL + 1, Alignment tab).  I generally like to keep my titles short.  If they are too long, I use multiple rows.  I like to group headings together under 1 heading if they are related.  For example, I grouped “Projected Yearly Sales” and “R&D Expense” under “Financials”.  Columns should be as thin as possible so that the exhibit itself can be blown up on a deck.  I also like to remove gridlines on exhibits.  Gridlines are helpful when you are running calculations or modeling, but they are ugly.  Therefore, they should not be included in a client exhibit.

To see the exhibits that I built on a spreadsheet, please click here.


Friday, December 23, 2011

VLOOKUP and MATCH, the perfect couple


VLOOKUP and MATCH, the perfect couple…
A lot of you are probably familiar with VLOOKUPs, and a lot of you may even be familiar with the MATCH function, but did you know that you can combine them together and create magic?  Seriously, VLOOKUP + MATCH is like wine + cheese, Romeo + Juliet, or chips + salsa.


Suppose you have a spreadsheet with a lot of data.  Each order is unique and has the fields Plan, PM, Description, Cost, Rating, Value, and Quality associated with it.  For example:


Sheet1


Then suppose you want to transfer all this data to another sheet, but with only a subset of the above fields.  One way to do it is to set cell references.  But when you start cutting and pasting stuff, it will get confusing.  However, there is a way to use 1 formula to pull all the values that you need.  Here’s where the VLOOKUP + MATCH come in to play.  On a blank spread sheet (Sheet2), create the design for your output and choose the orders and fields that you want to display.

Sheet2

Then, you can write 1 formula to populate all the blank cells based on the order number and field title.  For example, in cell B2, write: =vlookup($A2,Sheet1!$A$1:$H$21,match(B$1,Sheet1!$A$1:$H$1,0),0)

Make sure that the arrays used in the VLOOKUP and MATCH function refer to the data sheet and not the sheet of your output.  This is important!

So, with the above formula, you can paste it into all the blank cells, and the formula will pull the data you need.  The VLOOKUP looks for the order number you specified, and the match function finds the specific field you are interested in.  Voila!  Same formula can be pasted repeatedly to pull different data points.  The locking that I have specified directs the formula to point at the relevant order number and field no matter where you paste the formula.

Keep in mind that you do not have to use the titles as your match range.  You can use a blank row above your titles and above your data to create a new match range.  E.g.


Data

Exhibit

In this case, you just set the MATCH range to the first row.  This allows you to set up your own naming convention for the MATCH function, so you’re not limited to the titles of your exhibit.  Just remember to reference your new MATCH range when you set the array for the MATCH function.

This VLOOKUP + MATCH concept is very powerful and useful for building exhibits, transferring data, or viewing data in a specific way.  It’s quick and efficient once you get the hang of it, and minimizes chances of error.

Here is a spreadsheet demonstrating my example.